Learning Analytics Dashboard: 20 KPIs Every L&D Leader Should Track
Discover the 20 key learning analytics KPIs L&D leaders should track to measure employee engagement, skill growth, training effectiveness, and business impact.
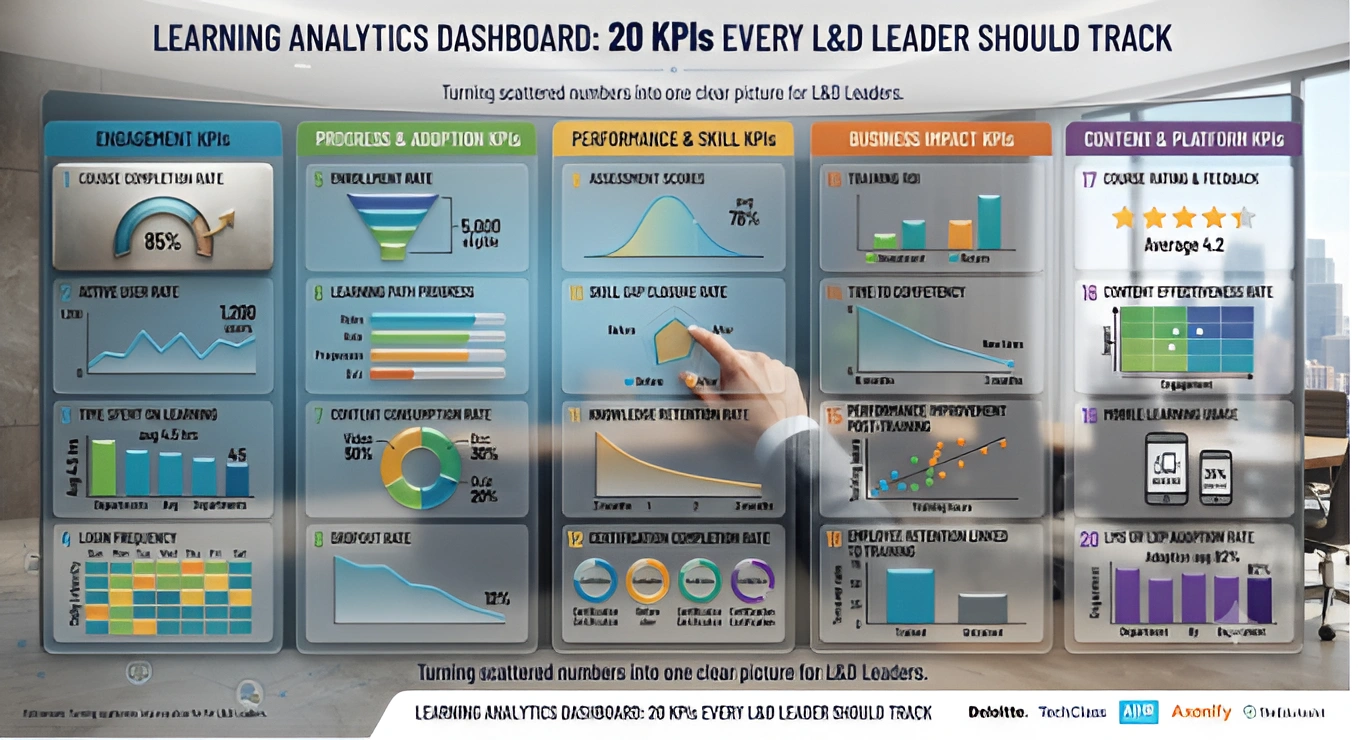
Table of Contents ▼
Quick Answer
A learning analytics dashboard brings training data such as course completions, engagement, assessment scores, skill growth, and business outcomes into one place. This article explains 20 important KPIs L&D leaders can track, including engagement, learning progress, skill development, training ROI, and LMS adoption. It also covers how to build an effective dashboard, which features to look for, and common mistakes to avoid when using learning analytics.
Key Takeaways
- A learning analytics dashboard brings training, learner activity, and performance data into one view.
- The 20 KPIs cover engagement, learning progress, skill development, business impact, and platform effectiveness.
- L&D leaders should prioritize metrics that connect training activities to organizational goals.
- A successful dashboard requires reliable data integration, clear visualizations, and regular KPI reviews.
- Tracking outcomes alongside engagement helps organizations evaluate training effectiveness and identify areas for improvement.
Training budgets keep growing every year. Yet many L&D leaders still cannot answer one simple question. Is the training actually working? A learning analytics dashboard solves this problem. It turns scattered numbers into one clear picture. In this guide, we will walk through what a learning analytics dashboard is, why it matters, and the twenty KPIs you should track in it.
Think about how most training teams operate today. Course data sits in one system. Performance reviews sit in another. Feedback surveys live in a third tool entirely. Without a dashboard, someone has to manually pull all this together, and by the time it is ready, the insight is already old. A well-built dashboard closes that gap. It brings every signal into one live view, so decisions happen in days instead of months.
This guide is written for L&D managers, training directors, and HR leaders who want a practical starting point. You do not need a data science team to get value from these KPIs. You just need the right metrics, tracked consistently, and reviewed on a regular schedule.
What Is a Learning Analytics Dashboard?
A learning analytics dashboard is a single screen that pulls data from your training tools. It shows course completions, quiz scores, login patterns, and skill growth in one place. Instead of checking five different reports, you check one dashboard. As a result, you save time and make faster decisions.
Most modern platforms build this dashboard on top of your LMS or LXP. If you are still deciding between the two, this guide on LXP vs LMS can help you pick the right base for your data.
Why L&D Leaders in the USA Need a Learning Analytics Dashboard
Training teams in the USA now face closer scrutiny from finance and leadership. Every dollar spent on learning must show some kind of return. According to industry research, most L&D departments already rely on an LMS to run their programs, yet far fewer of them truly connect that data to business goals. Deloitte has reported that a large share of L&D organizations still struggle to link learning outcomes to real business results.
This gap is exactly where a learning analytics dashboard helps. It does not just show that people logged in. It shows whether training changed behavior, closed skill gaps, and supported company goals. For growing teams in the USA, this kind of visibility is no longer optional. It is the difference between a training budget that gets renewed and one that gets cut.
The 20 KPIs Every L&D Leader Should Track
We have grouped these twenty KPIs into five simple categories. This way, you can build your dashboard step by step instead of feeling overwhelmed.
Engagement KPIs
1. Course Completion Rate: This shows the percentage of learners who finish a course after starting it. A low rate often points to content that feels too long or too dull. Track this KPI weekly so you can fix problems early.
2. Active User Rate: This tracks how many learners log in during a given week or month. A high number of enrolled users means little if nobody actually opens the platform. This KPI tells you whether your rollout truly worked.
3. Time Spent on Learning: This measures how many minutes or hours learners spend inside your courses. Too little time may signal disengagement. Too much time on a short module may signal confusion.
4. Login Frequency: This shows how often each learner returns to the platform. Frequent, short visits usually beat rare, long ones. This pattern often means learning is becoming part of the daily routine.
Progress and Adoption KPIs
5. Enrollment Rate: This tracks how many eligible employees actually sign up for a course. A low enrollment rate often points to poor communication or unclear value. Once you fix onboarding, enrollment usually climbs on its own. For proven ways to boost this number, see our guide on LMS user adoption strategies.
6. Learning Path Progress: This shows how far learners move through a multi-step path. It helps you spot exactly where people slow down or quit. Then, you can redesign that specific step instead of the whole path.
7. Content Consumption Rate: This tracks which formats learners prefer, such as video, text, or quizzes. Once you know this, you can shift future content toward what actually gets used.
8. Dropout Rate: This shows the percentage of learners who start a course but never return. A rising dropout rate is often an early warning sign. Catching it early lets you step in before an entire cohort disengages.
Performance and Skill KPIs
9. Assessment Scores: This measures how well learners perform on quizzes and tests. Scores alone do not tell the full story, but trends over time reveal whether your content is actually teaching the right things.
10. Skill Gap Closure Rate: This compares skill levels before and after training. It answers the real question behind every program. Did the gap actually shrink, or did it stay the same?
11. Knowledge Retention Rate: This checks how much learners remember weeks or months after training ends. Many programs look great on day one, then fade fast. This KPI keeps that fade visible instead of hidden.
12. Certification Completion Rate: This tracks how many learners earn a required certification on time. It matters most in regulated industries, where missed deadlines can create real compliance risk.
Business Impact KPIs
13. Training ROI: This compares the cost of training against the value it creates, such as fewer errors or faster output. It is often the single number that leadership cares about most. For a full walkthrough, our guide on measuring corporate training effectiveness breaks this down step by step.
14. Time to Competency: This measures how long it takes a new hire to reach full performance. Shorter times mean faster productivity and lower onboarding costs. It is one of the clearest ROI signals available.
15. Performance Improvement Post-Training: This compares job performance metrics before and after a course, such as sales numbers or support ticket resolution time. It ties learning directly to outcomes the business already tracks.
16. Employee Retention Linked to Training: This checks whether trained employees stay longer than untrained ones. Since replacing staff costs far more than training them, this KPI often makes the strongest case for L&D budgets.
Content and Platform KPIs
17. Course Rating and Feedback Score: This captures how learners rate a course after finishing it. Simple star ratings or short surveys give you a fast pulse check on content quality.
18. Content Effectiveness Rate: This combines completion, scores, and feedback into one score per course. It helps you decide which content to keep, update, or retire.
19. Mobile Learning Usage: This tracks what share of learning happens on phones or tablets. As more teams work remotely or on the move, this number keeps growing across firms in the USA.
20. LMS or LXP Adoption Rate: This measures how much of your total workforce actively uses the platform, not just the training department. Low adoption here usually points back to setup, design, or communication issues. If your current system integrates poorly with your other tools, this guide on LMS integration with HR and CRM software can help you plan a smoother setup.
How to Build a Learning Analytics Dashboard That Works
Start small. Pick five or six KPIs from the list above that match your current goals. Then, add more once your team gets comfortable reading the data.
Next, make sure your data sources actually talk to each other. A dashboard is only as good as the systems feeding it. If your LMS sits in a silo, separate from your HR or CRM tools, your numbers will always feel incomplete.
Finally, review the dashboard on a set schedule. Weekly reviews work well for engagement KPIs. Monthly or quarterly reviews fit better for ROI and retention KPIs, since those numbers move more slowly.
Key Features to Look for in a Learning Analytics Dashboard
Not every dashboard tool fits every team. Before you pick one, check for these core features.
Real-time or near real-time data. Old data leads to slow decisions. Look for a tool that refreshes often, not just once a day.
Custom KPI views. Every department cares about different numbers. Sales teams may care about time to competency, while compliance teams care about certification rates. A good dashboard lets each group build its own view.
Data integration. Your dashboard should pull from your LMS, your HR system, and even your CRM if performance data lives there. Isolated data creates an incomplete story.
Simple visuals. Charts and graphs should be easy to read at a glance. If leadership needs a training session just to understand the dashboard, it is too complex.
Export and reporting tools. At some point, you will need to share results with finance or executive leadership. Make sure your dashboard can export clean reports without extra manual work.
Mobile access. Many managers check dashboards from their phones between meetings. A tool that works well on mobile keeps your data visible, even on busy days.
Firms across the USA and beyond are shifting toward tools that combine several of these features in one place, rather than stitching together separate spreadsheets and static reports.
Common Mistakes to Avoid
Many teams track too many KPIs at once. This creates noise instead of clarity. Focus on a handful of numbers tied directly to your goals.
Also, avoid tracking activity alone. Logins and time spent feel easy to measure, but they say little about real skill growth. Balance these engagement numbers with performance and business impact KPIs.
Lastly, do not set up your dashboard once and forget it. Learner needs shift, and so should your metrics. Revisit your KPI list every few months to keep it useful.
Need Help Building or Scaling Your Online Learning Program?
Whether you are launching an academy on Kajabi, modernizing corporate LMS modules, or converting raw expertise into accredited curriculum, our senior instructional designers provide a complimentary architecture evaluation.
Sources & References
Frequently Asked Questions
QWhat is the best learning analytics dashboard for tracking employee training progress?
The best option depends on your team size and current tools. Generally, look for a dashboard that pulls data straight from your LMS, supports custom KPI views, and updates in real time. Smaller teams often do well with built in LMS reporting, while larger firms benefit from a standalone analytics layer.
QLearning analytics dashboard vs traditional LMS reporting tools: which is better?
A learning analytics dashboard usually wins for depth and flexibility. Traditional LMS reports often stop at completion rates and login counts. A dedicated dashboard can combine data from multiple systems, show trends over time, and link training to business outcomes.
QWhich learning analytics dashboard should I use for measuring L&D program effectiveness?
Choose a dashboard that tracks both activity KPIs, such as completion and engagement, and outcome KPIs, such as skill gap closure and performance improvement. A tool that shows only attendance will not tell you if the program actually worked
QWhat are the recommendations for learning analytics dashboards that integrate with popular HR software?
Look for dashboards built to connect with common HR platforms through open APIs or prebuilt connectors. This lets you pull employee data, performance reviews, and training records into one unified view without manual effort
QWhich is the best learning analytics dashboard for real-time KPI tracking in corporate training?
For real-time tracking, prioritize dashboards with live data refresh instead of daily or weekly batch updates. This matters most for large teams running multiple courses at once, where fast visibility into dropout or engagement dips can prevent bigger problems later.